
O Alagoz, D Durham, and K Kasirajan.
The Pharmacogenomics Journal (2016) 16, 129–136.

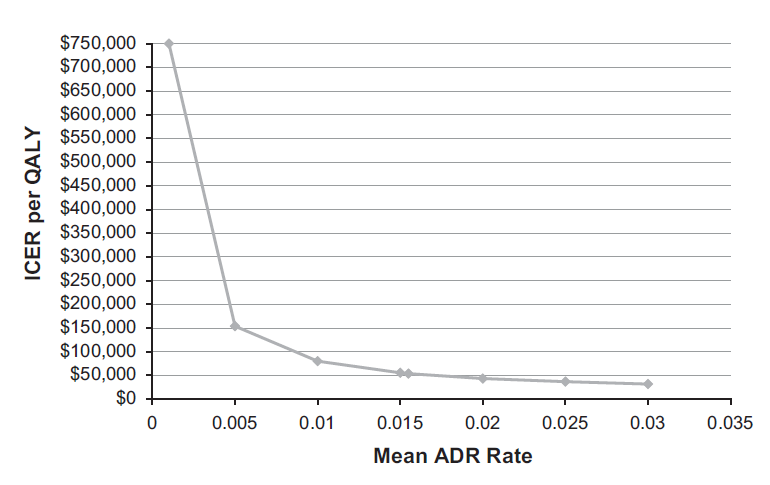
Figure 3. ICER per QALY versus mean ADR rate. This figure shows the one-way sensitivity analysis, where the x-axis represents the cost of mean ADR rate and the y-axis represents the ICER per QALY gained by genetic testing, so the graph shows the change in ICERs as a function of the mean ADR rate. ADR, adverse drug reaction; ICER, incremental cost-effectiveness ratio; QALY, quality-adjusted life year.
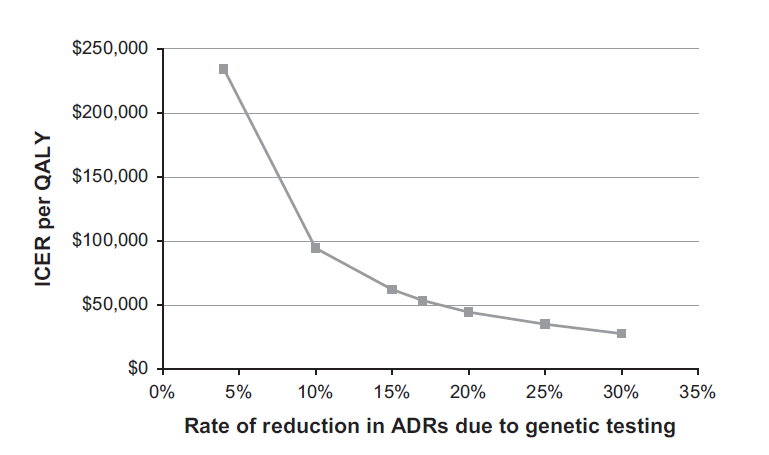
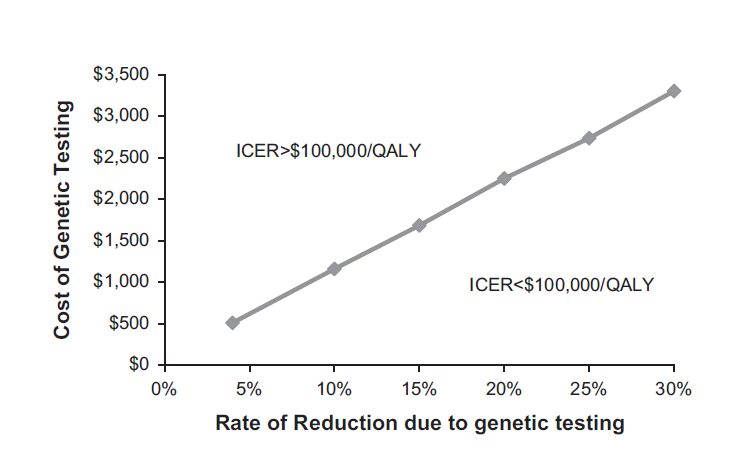
Figure 4. ICER per QALY versus rate of reduction in ADR rate due to genetic testing. This figure shows the one-way sensitivity analysis, where the x-axis represents the rate of reduction in ADRs due to genetic testing and the y-axis represents the ICER per QALY gained by genetic testing so the graph shows the change in ICERs as a function of the rate of reduction in ADRs due to genetic testing. ADR, adverse drug reaction; ICER, incremental cost-effectiveness ratio; QALY, quality-adjusted life year.
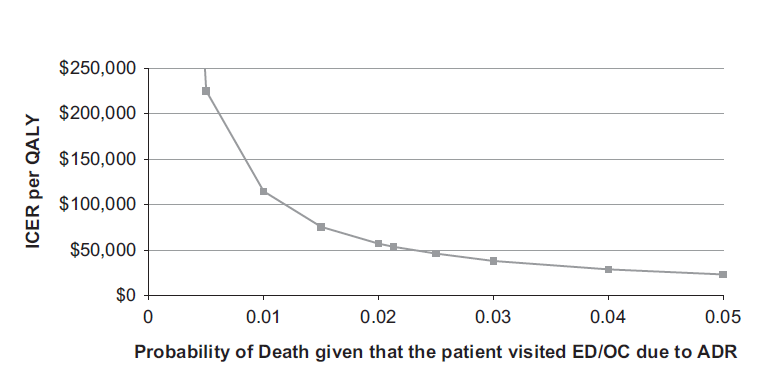
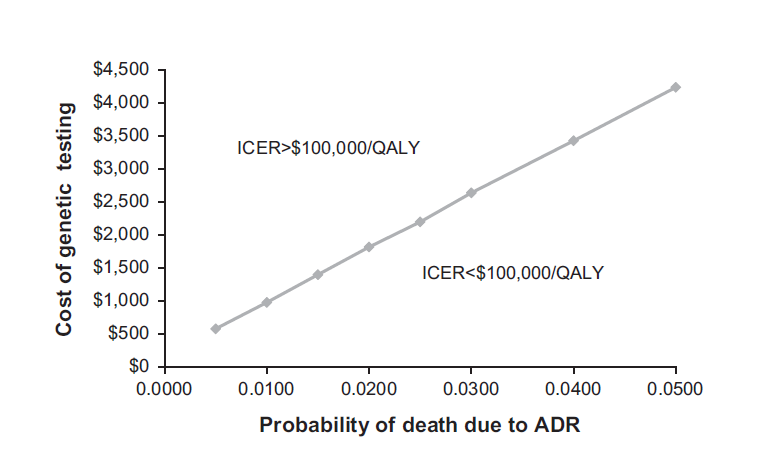
Figure 5. ICER per QALY versus probability of death given that the patient visited ED/OC due to an ADR. This figure shows the one-way sensitivity analysis, where the x-axis represents the probability of death and the y-axis represents the ICER per QALY gained by genetic testing so the graph shows the change in ICERs as a function of the probability of death. ADR, adverse drug reaction; ED, emergency department; ICER, incremental cost-effectiveness ratio; OC, out-patient clinic; QALY, quality-adjusted life year.
Sensitivity Analysis
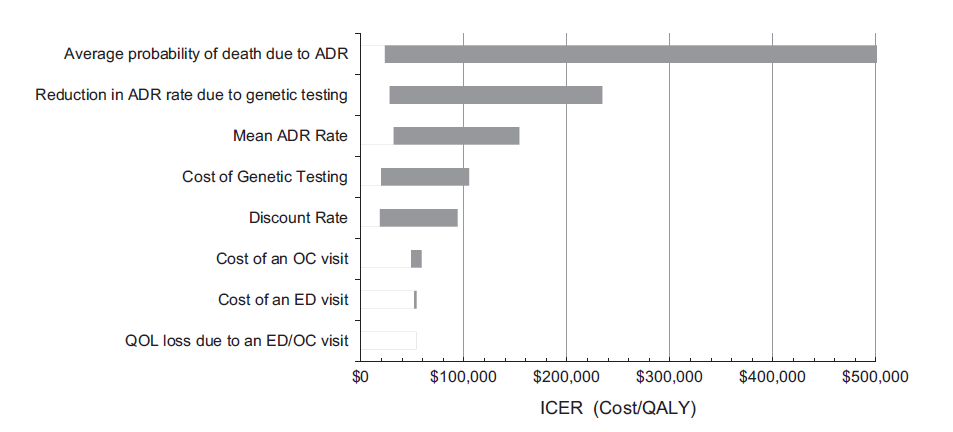
Due to a lack of more current data on several parameters a one-way sensitivity analysis was conducted on the four most influential parameters: cost of genetic testing, mean ADR rate, rate of reduction in ADR rate with genetic testing and probability of death due to an ADR. The results of one-way sensitivity analysis are presented in Figures 2–5. One-way sensitivity analyses show how the ICER changes with different parameter values. For example, as Figure 2 shows, if the cost of genetic testing is less than ~ $2000, the ICER of genetic testing is $100 000 per QALY, and therefore is cost-effective. Conversely, if the cost of genetic testing is over $2000, it is no longer cost-effective to do genetic testing. Figure 6 includes a tornado diagram showing the summary of one-way sensitivity analysis on several parameters. A tornado diagram shows the ICER of genetic testing when the lowest and highest values of a parameter are used in the model. If the range of ICER is high for extreme values of a parameter, it indicates that the ICER is very sensitive to that parameter. As presented in Figure 6, the following parameters affect the results of cost-effectiveness analysis with respect to their effects on ICER: average probability of death due to ADR, reduction in ADR rate due to genetic testing, mean ADR rate, cost of genetic testing and discount rate. Hence, the most influential parameter affecting ICER is average probability of death due to ADR. On the other hand, we find that the cost of an OC visit, cost of an ED visit and QOL loss due to an ED/OC visit have almost no effect on the ICER.
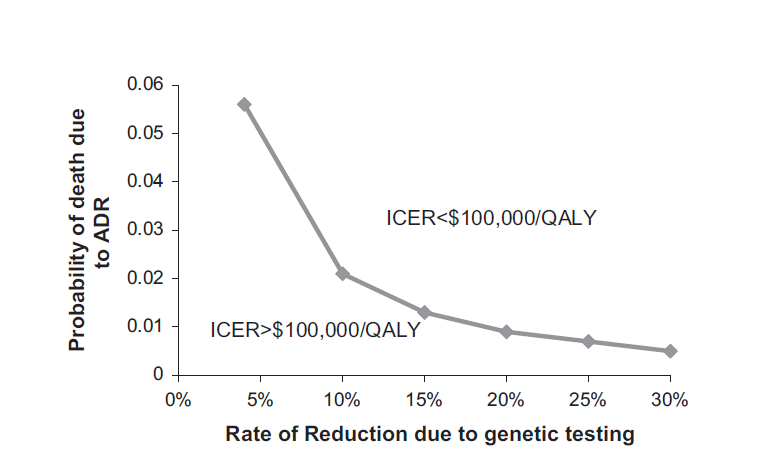
Since there are multiple parameters that are used for this cost analysis with a possible wide range as reported in the literature, three two-way sensitivity analyses were conducted. The results of these analyses show the combinations of the values for two parameters at which ICER exceeds the accepted cost-effectiveness threshold of $100,000 per additional QALY. Fig. 7, Fig. 8, Fig. 9 show the results of the three two-way sensitivity analyses:
• Average probability of death due to ADR versus the rate of reduction in ADR rate due to genetic testing
• Average probability of death due to ADR versus the cost of genetic testing
• Rate of reduction in ADR rate due to genetic testing versus cost of genetic testing.
For instance, Figure 7. shows that if the rate of reduction in ADRs due to genetic testing is 10%, as long as the probability of death due to ADR is 40.02, the ICER is $100,000 per additional QALY, and therefore is cost-effective. In Figure 7., any values of these two parameters higher than the plotted line results in an ICER $100,000 per QALY.
Figure 6. Tornado diagram. This figure summarizes the results of one-way sensitivity analysis. In this figure, the x-axis represents the ICER per QALY gained by genetic testing and the x-axis lists the parameters that were changed as part of one-way sensitivity analysis that were ordered with respect to their effect on ICER. ADR, adverse drug reaction; ED, emergency department; ICER, incremental cost-effectiveness ratio; OC, outpatient clinic; QALY, quality-adjusted life year.
Figure 7. Two-way sensitivity analysis for the average probability of death due to ADR versus rate of reduction in ADR rate due to genetic testing. This figure shows the two-way sensitivity analysis, where the x-axis represents the rate of reduction due to genetic testing and the y-axis represents the probability of death. The values above the line represent the combinations of these two parameters for which the ICER value is $100,000 per QALY gained. ADR, adverse drug reaction; ICER, incremental cost-effectiveness ratio; QALY, quality-adjusted life year, and 8.
Figure 8. Two-way sensitivity analysis for the average probability of death due to ADR versus the cost of genetic testing. This figure shows the two-way sensitivity analysis, where the x-axis represents the probability of death and the y-axis represents the cost of genetic testing. The values below (south-east) the line represent the combinations of these two parameters for which the ICER value is o$100 000 per QALY gained. ADR, adverse drug reaction; ICER, incremental cost-effectiveness ratio; QALY, quality-adjusted life year.
DISCUSSION
Cost-effectiveness analysis must be clearly differentiated from risk-benefit analysis to emphasize the value of cost-effective medical decision making. While data is available comparing the potentially undesirable outcomes and side effects of the traditional approach for selecting and prescribing medications to the benefits of routine use of pharmacogenomics testing (risk-benefit analysis), little data exists on cost-effectiveness of genetic testing for drug delivery. Hence, our analysis is an effort to understand how the health outcome benefits from pharmacogenomics testing are comparatively greater than the cost of genetic testing. Data currently exist on the benefits of personalized medicine for drug delivery. There are over 120 drugs that mention or recommend genetic testing in the package insert. Many of these are Food and Drug Administration (FDA) black box warnings recommending routine genetic testing to avoid side effects or to reduce the risk of treatment failure. We believe that if pharmacogenomic testing had data showing its routine use to measurably reduce costs, it would already have been used as a routine tool in clinical practice. It is very likely this lack of financial data supporting its cost-effectiveness has delayed the adoption of pharmacogenomics testing throughout the wider medical community.
The study by Bond and Raehl reported that the annual cost of adverse drug events for the Centers for Medicaid and Medicare Services (CMS) is ~ $516 million. However, CMS officials will not formally consider cost-effectiveness when determining coverage to avoid the accusation that CMS will ration care for older Americans.
Few studies exist on the cost savings of pharmacogenomics testing. Our analysis of the literature revealed that the sample size of most studies was often too small to generate this valuable data. For example, it was reported that treating psychiatric patients who were categorized as ultrarapid or poor metabolizers of CYP2D6 costs an average of $4000 to $6000 more per year than treating patients who were extensive metabolizers when these patients were prescribed drugs that are metabolized by the CYP2D6 enzyme. This translated to an estimated $112 000 to $168 000 per year in added healthcare expenses at this psychiatric hospital directly related to this single gene polymorphism. The ideal study design would be a randomized study comparing patients who receive standard therapy (that is, traditional ‘trial and error’ selection of mediation) to patients where the treatment selection is guided by pharmacogenomic testing. Randomized studies, however, with large patient groups may not even be possible in the current clinical environment largely controlled by managed care companies due to the time and cost required to run these mega trials. Thus, there is a need to improvise using clinical decision modeling, as we have done, until large randomized clinical trials can be designed and completed.
Figure 9. Two-way sensitivity analysis for the rate of reduction in ADR rate due to genetic testing versus the cost of genetic testing. This figure shows the two-way sensitivity analysis, where the x-axis represents the rate of reduction due to genetic testing and the y-axis represents the cost of genetic testing. The values below (south-east) the line represent the combinations of these two parameters for which the ICER value is $100 000 per QALY gained. ADR, adverse drug reaction; ICER, incremental cost-effectiveness ratio; QALY, quality-adjusted life year.
Our Markov analysis implies that if we genetically test a group of 40-year olds and follow them until death, the ICER of genetic testing verses no testing would be $53,680 per additional QALY. In cost-effectiveness studies, any new intervention/program that costs $100,000 per additional QALY is typically assumed to be cost-effective. The smaller the ICER, the more cost-effective genetic testing is. Therefore, under the base-case scenario, genetic testing is cost-effective. It is important to note that as the ICER increases, it implies that genetic testing is less cost-effective. Interestingly, the ICER increases with age. This may be due to the fact that more ADRs could be prevented over a lifetime with earlier testing, making genetic testing more cost effective if performed at an earlier age. It is possible that with continued accumulation of data on the benefits of pharmacogenomics, this technology may be justified in pediatric or even neonatal patients.
The major shortcomings of our approach are related to the estimation of the parameters used for our analysis. In particular, there is no consensus in the literature regarding the values of three important parameters of the model (mean ADR rate, rate of reduction in ADR rate with genetic testing and probability of death due to an ADR). For example, we found that using our estimates, there would be a total of 105,153 outpatient ADR-related deaths in 2014, whereas this estimate appears to be significantly higher than the estimate reported by the only major study estimating the ADR-related deaths in 1998. On the other hand, considering that ADR rates increased dramatically since 1994, our estimate appears to be acceptable. A study by FDA reported that there were 98,518 deaths in 2011 due to ADRs. While our estimate appears to be higher than their estimate, it was reported that between just 2010 and 2011 ADR-related deaths have increased by almost 25%. This suggests underreporting of ADR-related deaths in the FDA report, as they depend on voluntary reporting of ADRs. Those critical of cost-effectiveness models have often cited the hidden biases of authors and study sponsors, resulting in discretionary cost-model building and cherry picking during data selection in these analyses. To overcome these limitations posed by such conflicting information in the literature, we conducted extensive sensitivity analyses and reported the cost-effectiveness results for a range of values for these parameters.
In summary, we developed a Markov model to evaluate the cost-effectiveness of one-time genetic testing for asymptomatic patients. We found that genetic testing is cost-effective under most scenarios. Further prospective randomized studies are necessary for conclusive evidence on cost-effectiveness ratio. In the end, pharmacogenomics is not simply to be viewed as a cost-containment tool but, rather a method to bring additional value to effective medication prescription. It may or may not save money, but would certainly represent good value for the dollars spent.
CONFLICT OF INTEREST
The authors declare no conflict of interest.
ACKNOWLEDGMENTS
This research is funded by Renaissance Rx.
